Under the Hood: Architecture
For those who love the technical details, here are the complete flowcharts of our platform.
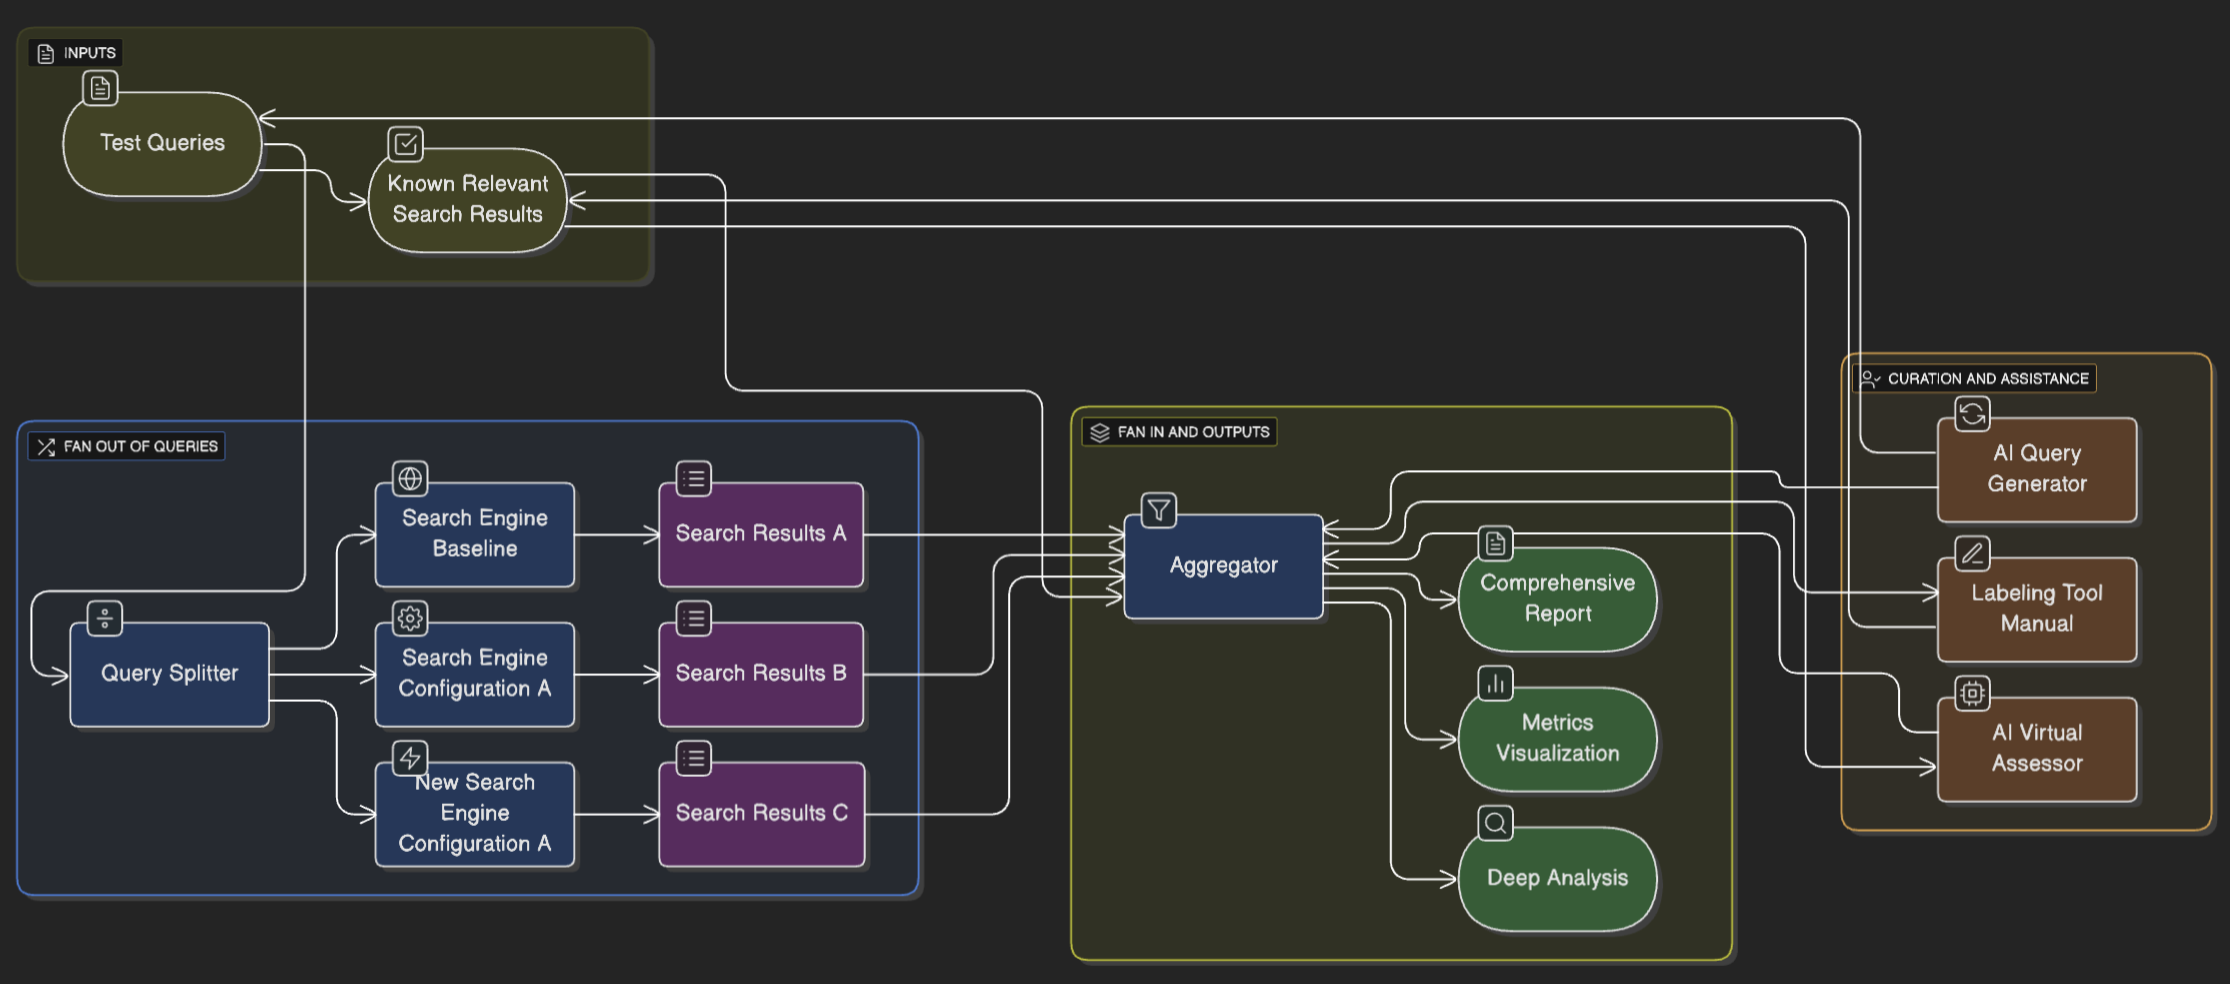
High-Level Process Flow
This diagram illustrates the journey from initial inputs to final, actionable outputs. It showcases how test queries and known results are processed through various search configurations, aggregated, and then transformed into comprehensive reports, visualizations, and AI-powered assessments.
Detailed System Architecture
This diagram provides a granular view of the services, data stores, and message queues that power the TestMySearch platform. Use the controls to zoom in and scroll horizontally to explore the details.
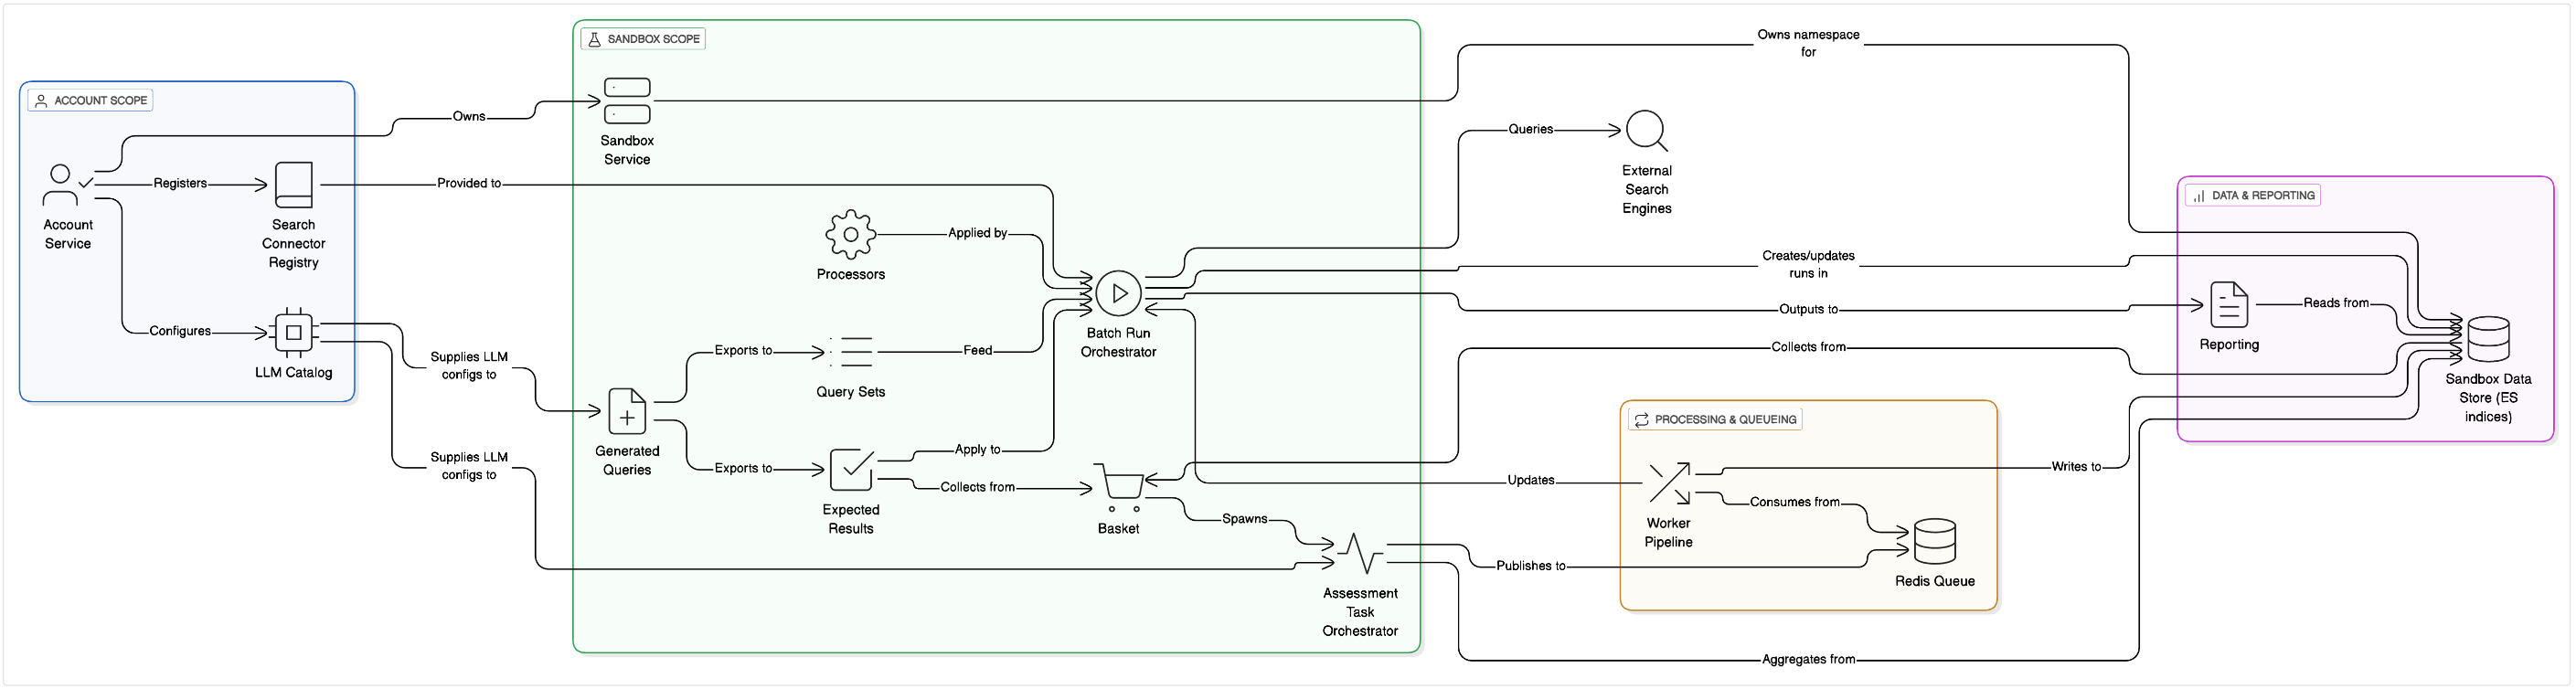
Architectural Breakdown
The platform is organized around two scopes — Account and Sandbox — with a processing pipeline that turns queries and known results into scored runs, derived insights, and reports. At the Account scope we provision shared registries (search connectors and LLM configurations); at the Sandbox scope we keep all experiment data isolated behind namespaced indices. The diagram shows how those scopes link to orchestration, workers, and reporting.
Account Service establishes cross-sandbox foundations. When an account is created, the service initializes account-level storage and account-level configuration (LLM and search connectors). LLM connectors define what LLM to use and how, and search connectors define the interfaces to search engines as well as define the way how to convert a query to a call to a search engine. These capabilities make search engine options and LLM settings centrally discoverable to all sandboxes under the account.
Sandbox Service provides isolation and namespacing. Every sandbox stores its artifacts in its own set of entities (e.g., pages, chunks, vectors, evaluations) so you can run aggressive experiments without polluting other environments. Operational code that wipes or rebuilds a sandbox touches only its entities, reinforcing that boundary.
The Search Connector Registry and LLM Catalog live at the Account scope but are consumed inside sandboxes. During run creation, users choose a search engine plus configuration from the Account, and downstream assessment steps read the chosen LLM configuration. This keeps selection consistent and auditable while still letting teams iterate rapidly in their own sandboxes.
Query Sets are the canonical inputs for test execution. We persist a dataset-level document and bulk store the individual queries as items. When needed, Query Sets can be created programmatically from CSV or by exporting from other parts of the system.
Expected Results hold the ground-truth mappings for evaluation. You can apply them to Batch Runs to compute metrics, or feed them into intent extraction when they’re placed in the Basket. These sets are sandbox-local, which ensures metrics and derived artifacts reflect exactly the data that was intended for a given experiment.
The Batch Run Orchestrator plans and tracks executions across chosen Query Sets and connector configurations. A run progresses through well-defined phases—download → chunk → vectorize → evaluate → update_run—and produces per-result evaluation scores that can be visualized or used later in Reports. Run creation also offers options such as auto-start and auto-applying Expected Results on completion.
Processors are pluggable pre- and post-processing hooks for queries and results. They are defined per sandbox and can be applied during Batch Runs, which makes it straightforward to test normalization, query rewriting, or custom ranking tweaks without forking the core pipeline.
The Basket is the cross-cutting staging area that turns selections into work. Teams can collect items from Expected Results, entire runs, or individual run results and then trigger Assessment Runs, Intent Extraction, or Query Generation. Each operation spawns an Assessment Task group with child items and status tracking, and the outputs (generated queries, intents, or scores) are written back to their respective sections.
The Assessment Task Orchestrator materializes a parent “group” task and many “doc” tasks, each with explicit phase statuses that mirror the worker pipeline. This structure allows independent progress across items, resilient retries, and aggregation of child states back to the group for monitoring and control.
The Worker Pipeline executes the heavy lifting asynchronously. Workers consume tasks, perform downloading, chunking, vectorization, and evaluation, then update the associated run with scores. Because the phases are explicit, the system can surface partial progress, rerun failed steps, and maintain a reliable audit of how each result was produced.
Generated Queries are another output surface of the pipeline. From assessments or query-generation workflows, you can export the selected generated queries either to a new Expected Results set (turning them into judged targets) or into a new Query Set (reusing them as inputs for future runs). Both export flows are implemented as in-memory CSV builds followed by bulk index writes.
Finally, Reporting reads from Batch Runs and assessments to generate comparative and clustering outputs. The catalog includes summary tables, query-by-configuration views, specialized clustering, and a broad set of ranking metrics—NDCG@5/10, Precision@5/10, Reciprocal Rank, Recall—as well as domain overlap, correlation, intersection, and even LLM-judgment reports when summaries are in play.
Together, these components form a reproducible, auditable feedback loop: accounts publish shared capabilities; sandboxes isolate experiments; orchestrated runs and assessment tasks produce metrics and derived assets; and reporting closes the loop with rigorous analytics. The result is a system where search quality work can scale from quick tests to large, multi-run studies without sacrificing clarity or control.